Wave Shape Infographic: A Flexible, High-Fidelity Template for Visual Planning and Communication
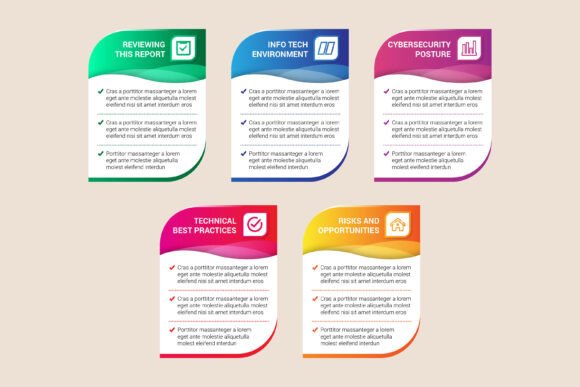
The Wave Shape Infographic is a purpose-built design resource that supports clarity in process visualization—whether you’re mapping a customer journey, outlining a product launch timeline, explaining a learning pathway, or comparing strategic options. Its defining feature is the rhythmic, flowing wave structure: not just decorative, but functionally adaptive. Unlike rigid linear charts or circular diagrams, the wave shape naturally accommodates progression with variation—peaks for milestones, troughs for reflection points, and gentle slopes for transitional phases. This makes it especially effective when representing non-linear growth, iterative workflows, or cyclical decision-making.
Where It Fits in Your Workflow
You don’t need to wait until a project is fully defined to use the Wave Shape Infographic. In fact, its greatest value often emerges early—during planning or alignment stages. For example:
- Before a project starts: Use it to sketch assumptions, identify dependencies, and surface gaps in stakeholder expectations. Marketing teams have used the wave layout to visualize campaign phases—from audience research (first crest) through creative development (valley), to A/B testing (second crest), and post-campaign analysis (final descent).
- During execution: Update it iteratively as real-world feedback arrives. Because all text, shapes, and colors are fully editable—and because the vector files scale cleanly at 300dpi—you can revise labels, shift timing, or add new icons without degrading quality. Educators, for instance, embed live metrics into each wave segment to reflect student engagement data across a semester-long module.
- After completion: Repurpose it as a retrospective summary. The visual rhythm helps audiences quickly grasp pacing, bottlenecks, and inflection points—not just what happened, but how momentum shifted over time.
Integration With Other Tools and Platforms
The Wave Shape Infographic doesn’t replace your project management software or presentation suite—it enhances them. Its native file formats (.Ai, .EPS, .SVG, and .JPG) ensure compatibility across environments:
- Import the .SVG directly into Figma or Adobe XD for collaborative annotation or interactive prototyping.
- Drop the .JPG into PowerPoint or Google Slides for client-facing decks—its high-resolution output avoids pixelation on large displays or printed handouts.
- Use the .Ai or .EPS files in Adobe Illustrator to extract individual icons, recolor entire sections to match brand guidelines, or combine elements with custom illustrations.
Because all layers are well organized and named intuitively (e.g., “Wave_Path”, “Option_Icons”, “Label_Group”), you can isolate components without disrupting the overall composition. That means you might pull just the five option icons for use in a separate checklist—or copy the color palette from the gradient wave base to maintain visual consistency across other assets in your toolkit.
Practical Implementation Tips
Start simple. Open the file in your preferred vector editor and spend five minutes exploring layer structure—not to edit, but to understand relationships. Notice how anchor points align across wave segments and how icon positioning follows consistent spacing rules. This familiarity saves time later when adapting the template.
When customizing text, avoid overloading any single wave segment. The design works best when each labeled section communicates one clear idea—“User Onboarding,” not “User Onboarding + Feedback Collection + First-Time Login Analytics.” If complexity demands more detail, use the wave as a top-level map and link to supplementary documents or dashboards.
For teams using shared design systems, treat the Wave Shape Infographic as a modular component. Assign one person to manage the master file (updating colors, fonts, and icon set quarterly), while others work from exported versions. This preserves version control without limiting flexibility.
Five Built-In Options: More Than Just Visual Variety
The five-option layout isn’t arbitrary—it reflects common decision frameworks used across disciplines:
- Comparison: Side-by-side evaluation of tools, vendors, or methodologies.
- Progression: Staged rollout of features, training modules, or policy changes.
- Priority: Visual ranking based on impact, effort, or urgency.
- Phasing: Time-bound sequencing—ideal for grant applications, compliance timelines, or product roadmaps.
- Pathways: Multiple routes to the same outcome (e.g., different customer acquisition channels).
Each option includes matching icons, so swapping between them maintains visual coherence. You’re not choosing a style—you’re selecting a functional lens. That distinction matters when stakeholders skim rather than read. A wave showing “Pathways” signals exploration; one labeled “Phasing” signals commitment to sequence.
Quality, Consistency, and Long-Term Usability
This isn’t a disposable graphic. Every element is 100% vector-based—no rasterized effects, no embedded fonts, no locked layers. That means you can resize it to billboard scale or shrink it to fit a mobile app tutorial without loss of fidelity. Text remains selectable and editable in any vector application, so updating dates, names, or KPIs takes seconds, not hours.
Organization extends beyond layers. Colors are built using swatches, not hex codes applied manually—so changing the primary brand color updates all wave segments and icons simultaneously. Icons follow a unified stroke weight and corner radius, ensuring they feel like part of a system, not an afterthought.
For long-term use, consider building a lightweight usage guide: a one-page PDF documenting which option aligns with which internal process (e.g., “Use Option 3 — Priority — for quarterly OKR reviews”). Share it with new team members or contractors. Consistent application multiplies the template’s ROI far beyond the initial download.
Who Benefits—and How
Entrepreneurs use the Wave Shape Infographic to simplify investor updates—replacing dense spreadsheets with intuitive motion that shows traction, adaptation, and future leverage points. Freelancers embed it in proposals to demonstrate methodology before quoting. Educators adapt it for syllabi, helping students see how weekly topics build toward final outcomes—not as isolated units, but as connected waves of understanding.
Even hobbyists find utility: someone planning a home renovation might map phases (design → permitting → framing → finishes) along the wave, then add photos or supplier notes to each segment. The structure imposes discipline without rigidity.
No tool replaces judgment—but the Wave Shape Infographic reduces friction between intention and expression. It gives shape to thinking that’s still forming, supports decisions that require nuance, and scales cleanly from whiteboard sketch to boardroom presentation. When clarity matters—and it almost always does—this is a resource designed to keep pace.